Profile of China's auto sales & production in August 2012
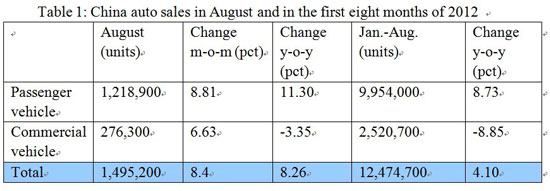
China’s auto sales amounted to 1,495,200 units in August 2012, year-on-year up 8.26 percent compared to the same period of 2011, according to statistics released by the China Association of Automobile Manufacturers (CAAM).
Auto sales jumped 8.4 percent in August compared to last month, statistics showed.
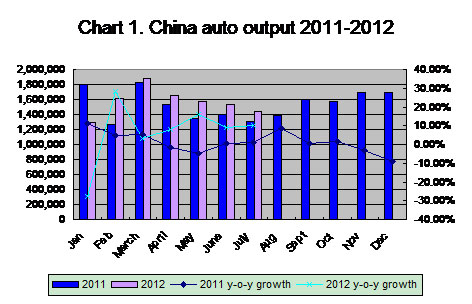
China’s auto sales and output are steadily climbing up in the first eight months, according to CAAM.
The following chart showsChina’s monthly auto output and sales since January 2011 (in unit):
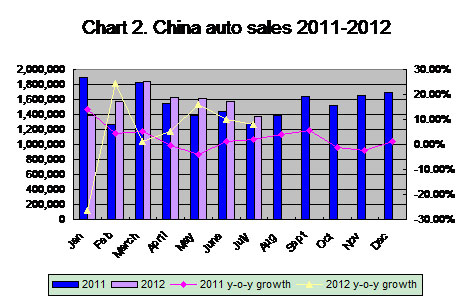
Here is another chart showingChina’s auto sales since January 2011 (in unit):
-- Passenger vehicles
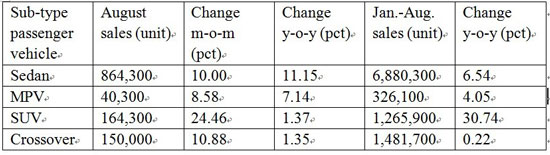
A total of 1.22 million sedans, multi-purpose vehicles (MPV), sports-utility vehicles (SUV) and crossovers were sold inChinain August, rising 10.00% percent from a year earlier and growing 3.69 percent from the preceding month.
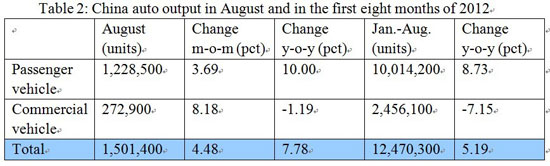
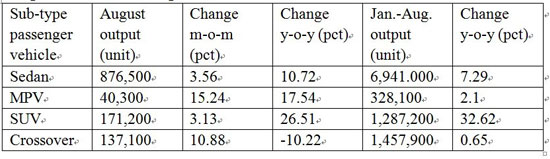
Output in the same month climbed 3.69 percent month on month and gained 10.00 percent year on year to 1.23 million units.
The following table shows the sales of major sub-type passenger vehicles in August and in the first eight months of 2012:
The following table shows the output of major sub-type passenger vehicles in August and in the first eight months of 2012:
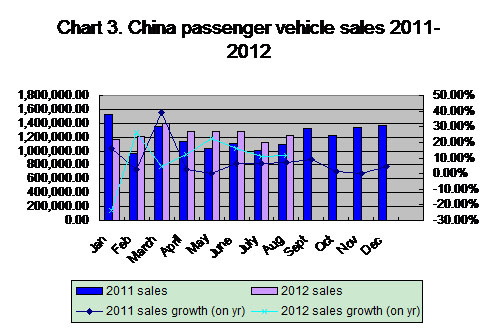
The following chart showsChina’s monthly passenger vehicle sales since January 2011 (in unit):
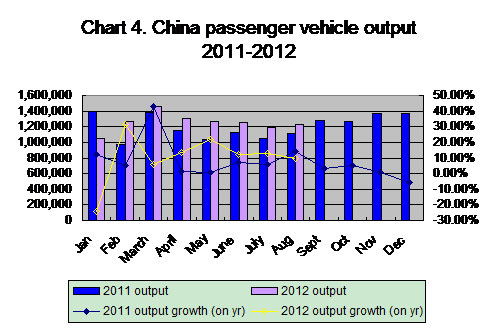
Here is another chart showingChina’s monthly passenger vehicle output since January 2011 (in unit):
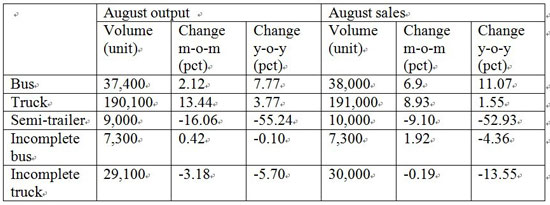
-- Commercial vehicles
China’s output and sales of semi-trailer and incomplete truck continued the downward trend in August, but others showed slightly increase in August.
The monthly commercial vehicle sales in August reached 276,300 units, up 6.63 percent month on month, but yearly down 3.35 percent. The output in the month grew 8.18 percent month on month, but yearly down 1.19 percent to 272,900 units.
The following table showsChina’s output and sales of sub-type commercial vehicles in August 2012, based on the CAAM data:
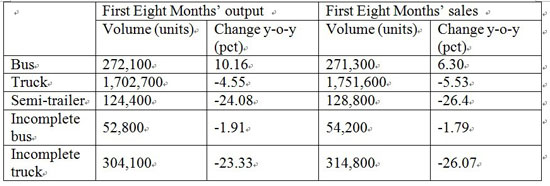
The following is a table showing the output and sales of sub-groups of commercial vehicles in the first eight months of 2012, based on the CAAM data:
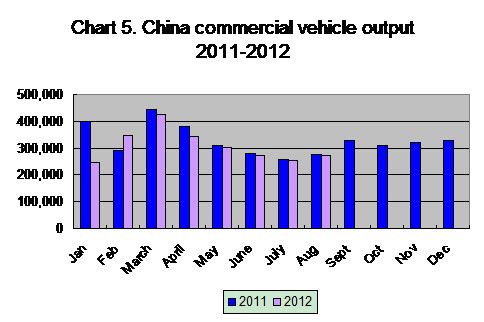
The following chart shows the monthly commercial vehicle output since 2010:
Here is another chart showingChina’s monthly commercial vehicle sales since 2010: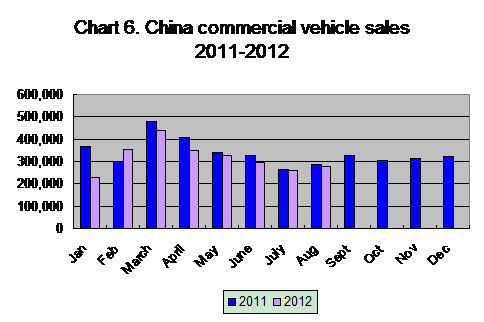


- Tireworld Insight: Domestic tire makers eye overseas expansion
- Tireworld Insight: Price disparity severe between China's rubber exports and imports
- Tireworld Insight: China tire exports dependent on US market performance
- Tireworld Insight: SHFE rubber expected to move in tight range in short-term
- Tireworld Insight: Rubber futures to test near-term resistance at 15,000 yuan/tonne
- Tireworld Insight: China’s tire industry on track of rapid growth